


Infogr.am is a free web service that lets you create simple, online infographics and charts for websites, blogs or to share through social media. While Infogr.am is not as sophisticated as other online tools, it is very straightforward and intuitive, making it a good choice for beginners. If you want to create a chart, you can choose between 30 types of charts such as pie charts, line charts, gauge charts, scatter plots, bubble charts and many more. If you decide to create an infographic you can drop these types of charts together with text, maps, photos and video onto the canvas.
The map feature is particularly innovative and automatically scales according to the countries for which you have data. For example, if all your data is from European countries, then your map will show only Europe. If you have data from all around the world, then it will show a world map. Unfortunately the automatic country detection only works in English, but Infogr.am plans to roll out multilingual support soon.
you can make professional looking charts and infographics in a couple of minutes.
a disappointing lack of export options. At the moment Infogr.am is exclusively geared towards online sharing. However, according to Infogr.am, they are working on adding additional export options in the next version. There are currently only six templates to choose from, but these are well designed and don’t force you to go down a specific route. All in all, Infogr.am is probably not a tool that seasoned designers will use. But if you are a beginner and quickly want to create something that looks sleek without having to read any instructions, then Infogr.am is an excellent choice.
Gentle
Yes.
You start by choosing whether you want to create an infographic or a chart. If you want to create a chart, you enter your data either manually or import Excel spreadsheets. If you prefer to create an infographic, you simply drag the different elements (text, maps, video, chart or image) onto the canvas. To share the graphic through social media or in order to embed it on your own website or blog, you need to publish the infographic. You then get an embed code or the option to share it directly on the most common social networks.
CSV, Direct entry, XLS and XLSX.
Embeddable.
English.
Neither privacy, nor portability are strengths of Infogr.am. Your graphics are hosted on the Infogr.am website and there is no mechanism to export the data for use in another application. In order to embed or share a graphic you need to publish it publicly.
Infogr.am
Proprietary
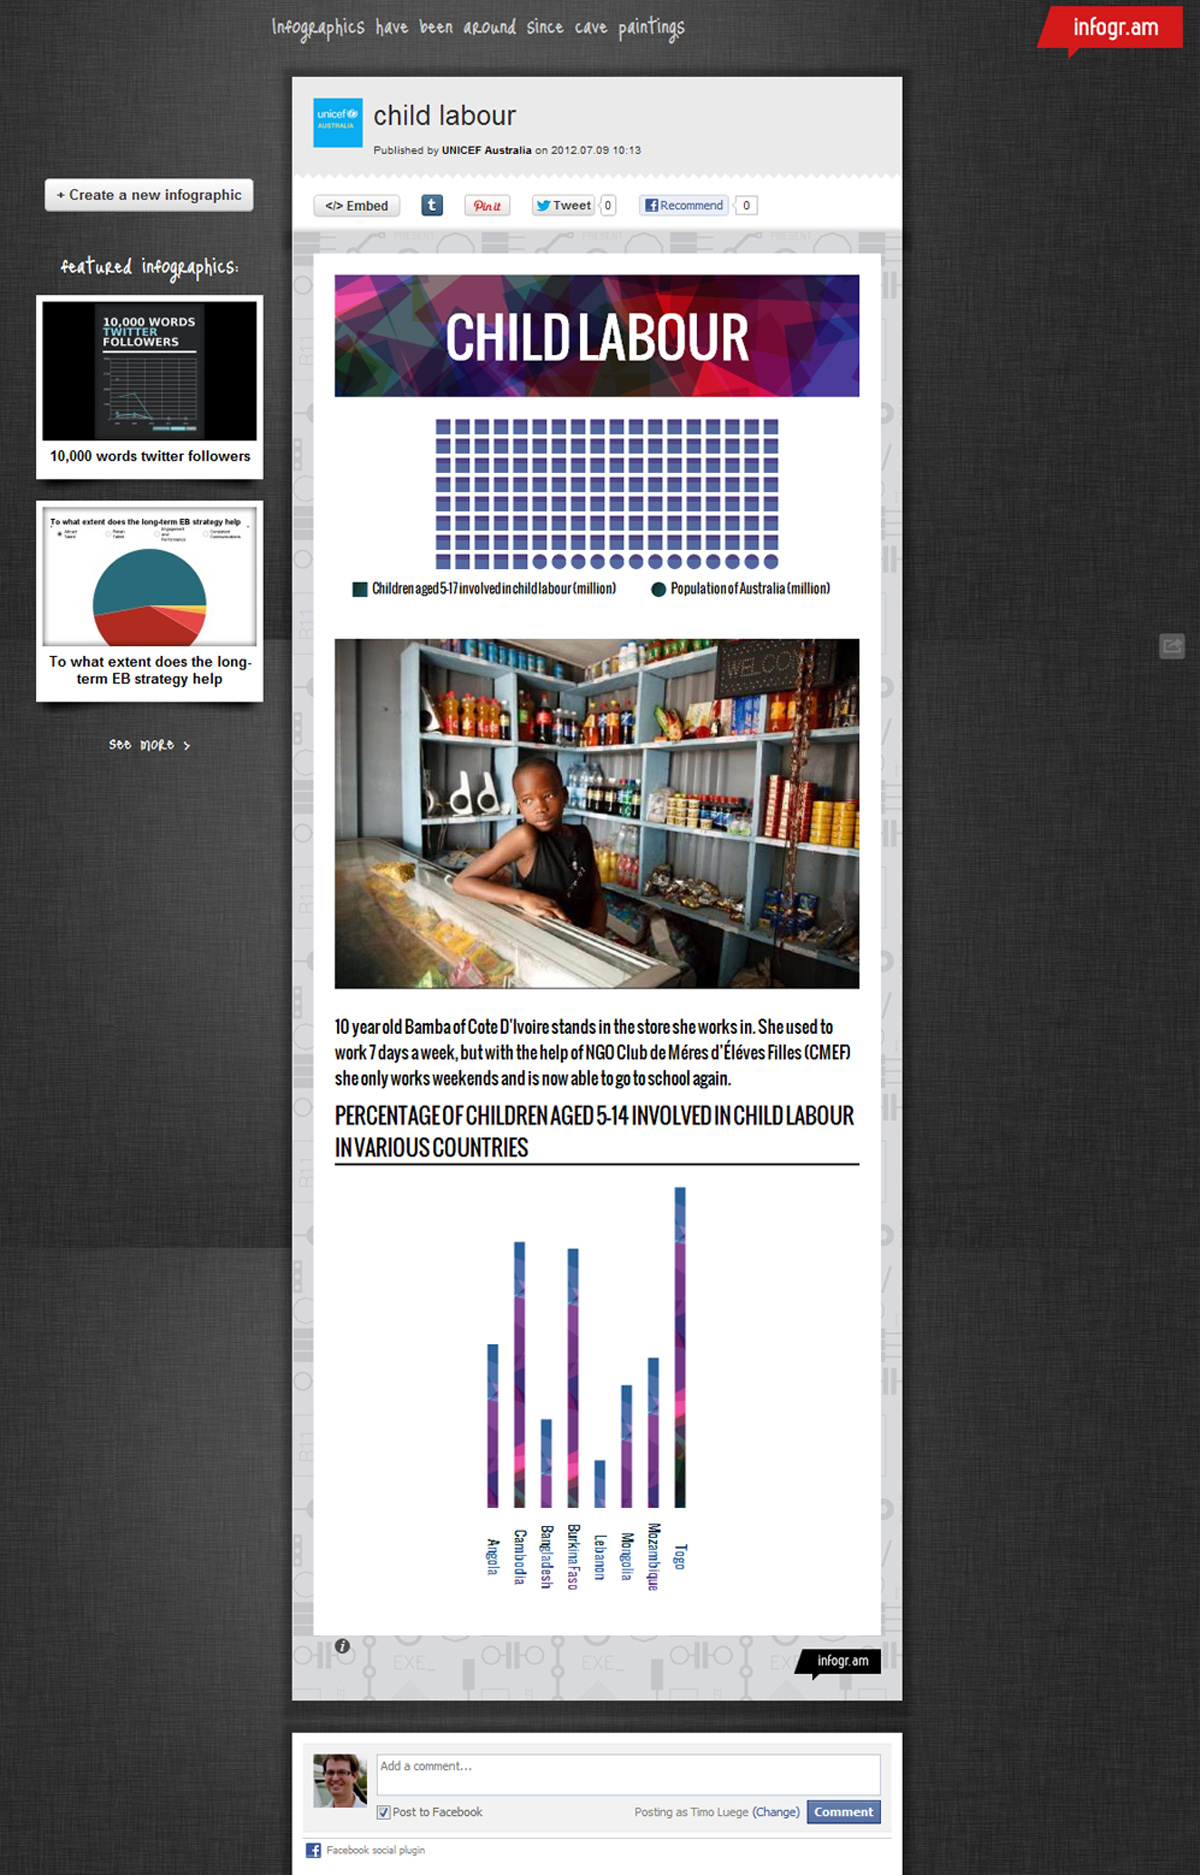
A gallery of infographics that were created by using Infogr.am