

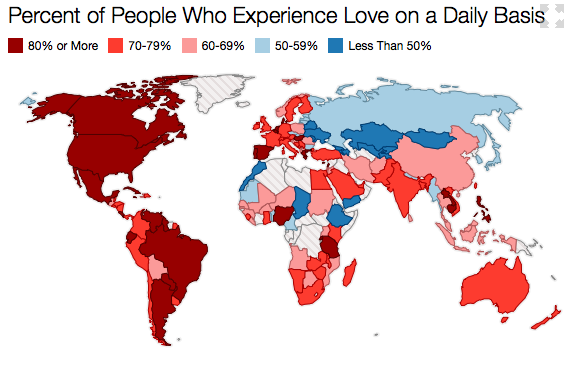

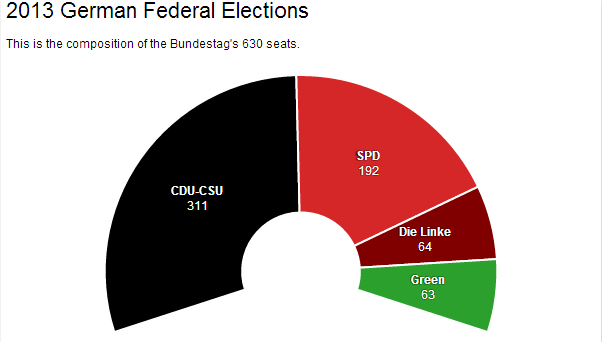
Datawrapper is a user-friendly, open-source web tool that you can use to create basic interactive charts. By loading your CSV dataset into Datawrapper you can make a chart or a map that can be embedded onto a website. Among others, you can generate pie charts, line charts, bar charts (horizontal and vertical) and maps.
it enables the creation of interactive charts in minutes, even seconds.
the limited possibilities of customisation. As Datawrapper is meant to be easy-to-use, as soon as you want to customise or extend its standard functionalities you need to fork the source code, modify it and install it into your own server.
Gentle
It can be used either online or installed onto your own server.
The typical creation process of an interactive chart consists of five steps. First, find the dataset (if you want to experiment you can find some sample datasets in the first step of the chart creation process). Second, clean the data (e.g., delete unnecessary rows, convert it into CSV). Third, upload it to Datawrapper. Fourth, visualise the data by selecting the type of charts you need (e.g. pie, bar or line chart). Finally, grab the embed code and publish the chart on your website.
CSV or direct input.
Interactive chart (embed code) or static image (.JPG).
English, French, Portuguese, Italian, Spanish, German and Chinese.
Yes. Once you upload your data you are placing it on Datawrapper's free hosting service or fork Datawrapper via Github so your data will be accessible to the internet. If you want to use this tool and have sensitive information then in order to keep your data safe it is advisable to install Datawrapper on one of your servers
Datawrapper is an open source project by ABZV - a German training institution for newspaper journalists.
Datawrapper is a non-commercial, open source software, licensed under the MIT License.
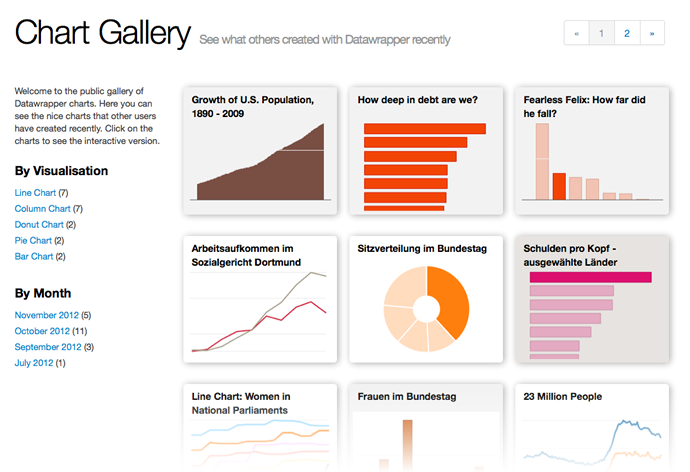
You can see many examples of charts in Datawrapper's gallery.
- Datawrapper quickstart guide and tutorials
- Easy steps for making charts and infographics using the free DataWrapper app by ijnet
- Screencast on how to create charts with Datawrapper by Journalism.co.uk